
Part 5: Storing GIS Data for the Web
You: Hey! What happened to Part 4???
Me: Well, this series is a work in progress, and sometimes progress is uneven. My original idea was for a trilogy of “web mapping for beginners” overview documents. But like Douglas Adams, once I start something, I find I can’t stop at just 3 parts. The series has now expanded to 7 parts to touch on most of the complex pieces of the web mapping process, and undoubtedly I will continue to edit and expand on them as I learn even after they are “finished.” I happened to delve into file types and databases before realizing it wouldn’t do not to write about JavaScript mapping libraries, and the proper order for that section is between Part 3 and this one. I think that posting as I go, although there may still be gaps in my knowledge, will help to keep these docs at “beginner” level so as not to unintentionally make them too daunting for someone just getting into this stuff, and I am now. I promise Part 4 is coming soon.
One more warning: this section is much longer than the previous ones. I debated splitting it into two sections, and I may yet do that, but for now I decided to keep file types and databases together because they all fit under the umbrella of geographic data storage.
There are lots of ways to turn an existing tile service into something new and interesting, which usually don’t require setting up your own server. The previous section discussed using a library or API to add layers to the map, which can be drawn dynamically from the script, can come from a WMS, or can be hosted privately in a separate GIS file. But if you have been surfing around the ’net for map services and are ready to try making your own, there are basically three steps:
- Store the data
- Make the images (tile or otherwise)
- Serve the map
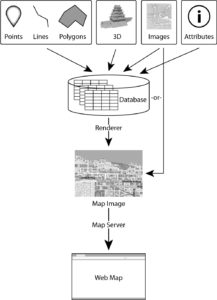
The steps of serving a map: 1) Data is aggregated, typically in a database; 2) a rendering engine is used to transform the data into an image, which can be done either on-the-fly or in advance and the image cached; 3) the image is served through a map server, which may also provide a rendering engine depending on the software used.
The first order of business is to know how the data—the points, lines, polygons, and/or images you want to use on your map—are stored and how to access them.
Without delving too deeply into the fundamentals of GIS, let’s review the two main types of GIS data. Vector data (points, lines, and polygons) are stored in tables as sets of geographic coordinates and attributes. They can be in CSV, ESRI Shapefile, XML/KML, GeoJSON, SVG, or a database format. Raster data, or collections of pixels that make up images, can be stored in a number of formats, including database formats, some of which have geographic data embedded. If the data includes coordinates that enable it to be projected accurately onto a map, it is said to be georeferenced.
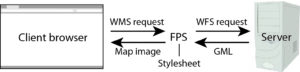
An important web standard for data transfer is XML (EXtensible Markup Language), a form of script that can be used to carry geographic and attribute data and metadata in a way that’s readable by humans and JavaScript/HTML. It has become an important language for transferring geographic data over the internet, so much so that early on the Open Geospatial Consortium (OGC) defined a Geography Markup Language (GML) standard, which continues to be updated and refined. It includes specific definitions for spatial data in vector, imagery, and real-time sensor formats. It doesn’t care about platforms or file structures, making it a universal tool. To repeat: GML is a language standard, not a file type. The transfer of GML-encoded data over the internet is accomplished with WFS, or Web Feature Service, another OGC specification like Web Map Service (WMS), only for GML data instead of map images. Data transferred through WFS can be displayed as a map in a client browser if it first gets rendered by a map server using a Feature Portrayal Service, which adds style rules to it to turn it into a map image.15
Of course, a lot of geographic data exists in a variety of other formats that can be used in desktop mapping applications like ArcGIS and Google Earth or parsed by script. In many cases, the files need to be interpreted or transformed for web use. A pair of open-source libraries provided by the Open Source Geospatial Foundation (OSGeo), called GDAL and OGR, are key for geospatial file processing. These may be incorporated into other programs to retrieve file information or convert between file types. GDAL deals entirely with raster files, while OGR is for vector files. As of this writing, OGR is able to read, create, and modify 25 different georeferenced file types, and GDAL can do the same with 45 raster types, plus many more they can either read or write but not both. These include a number of database formats. Obviously this is too much to cover in a short paper, but a few of those file types are the most commonly used on the web and worth discussing.
Vector Formats:
1. CSV: Comma-Separated Values (.csv), the simplest possible data table format, consists of a continuous string of values separated by commas and line breaks, and is usually read/modified using Microsoft Excel or similar table software. CSV is typically only used as a format for holding attribute data. In order for the data to be georeferenced, there must be columns for coordinates, almost always stored as latitude and longitude values.
2. ESRI Shapefile: Actually a collection of four or more files (.shp, .dbx, .shx, and .prj, optionally .sbn, .sbx, .xml, or .obr), each representing a different type of table or data manipulation, for years this has been the most widely-used format for transporting GIS data. It’s owned by ESRI, and lately being challenged for supremacy by KML and GeoJSON formats. Uploading shapefiles to web applications is typically done by first archiving them together in a zip file.
3. KML: Keyhole Markup Language (.kml, .kmz compressed; so-called because it was invented by Keyhole, Inc. before they were bought by Google) is an XML-based format for use in Google Earth. It’s readable/changeable in any text editor, and able to be projected by most mapping software that’s not made by ESRI. Now its own OGC standard, it mostly complies with the GML standard, but is much narrower in scope.16 For instance, KML doesn’t include datum or coordinate reference system information or metadata.
4. GeoJSON: JavaScript Object Notation (.json) is similar in concept to KML, but writes the data in JavaScript instead of XML. Theoretically this makes it easier for scripts written in various languages to access.
5. SVG: Scalable Vector Graphics (.svg) are XML-based graphics files, like KML but without the georeferencing. Unlike KML files, they can be rendered by any modern browser. They are typically created using graphics software such as the free program Inkscape or Adobe Illustrator, and can be layered directly onto a web map using an API or JavaScript library.17
Raster Formats:
6. GeoTIFF: Despite the large profusion of raster formats used in GIS and supported by GDAL, many have very specific uses or are proprietary to particular software packages. For specialized purposes, it’s worth consulting the documentation to find the best format. GeoTIFF is the most widely-used image format with embedded georeference data. It is organized just like a regular TIFF (Tagged Image File Format; .tif) file, but tagged with a header that includes geographic coordinate and projection information.
7. PNG: The Portable Network Graphic (.png) was invented as a successor to GIF and has become a standard format for raster web graphics. It was designed for the web, not for print, so it only uses RGB (light-based) colors and employs an efficient lossless compression scheme.18 An open format, it is commonly used for the 256×256 pixel tiles in tile maps. While it doesn’t natively support georeferencing, tiles are assigned addresses when rendered that correspond to their geographic positions, and methods can be used in tile services that translate pixel addresses to lat/long coordinates.
8. JPEG2000: The folks who brought us the wildly popular JPEG (.jpg) compressed image format designed JPEG2000 (.jp2) as its successor. But the format was essentially stillborn, failing to be adopted by most of its intended users due to a closed architecture and lack of support for specific applications. It has superior compression and can store GML data to make it georeferenced and even add vector layers.15 Despite these selling points, .jp2 is rarely seen in web maps. Its intended purpose was to speed the transfer of large images, but tile services using PNG files have bypassed that need.
9. DEM: Digital Elevation Model (.dem) rasters are used strictly to show elevation data. They are in black and white, and each pixel is assigned a value from 0-255 according to the elevation of that location. Freely available from USGS and NASA, DEMs can be used by GIS software to create a variety of useful layers, from hillshading to contours to 3D models.
Database Formats:
Say you have a layer of features on your web map that you want to add new features to or delete features from, or add new information about the features. Where can you store these features to make them easy to change? Databases give the advantage of neat organization and quick access to the data. A relational database is a collection of tables that can be cross-referenced using a common identifying attribute (column). An index that just stores the feature identifiers and the tables they appear in is used to speed up operations with the database. A database management system (DBMS) is typically used to access and write to the database. This is a program designed to interface with the database, usually using a version of Structured Query Language (SQL). A server needs a DBMS to serve geographic data stored in a database to clients on demand (but not to serve map images that are not stored in a database). Several DBMS systems can interpret geographic data. The three most popular are listed below.
MySQL: Oracle’s open-source DBMS is massively popular for all kinds of uses, including several of the web’s biggest sites. There is a free “Community” version and paid editions with more functionality. It comes with spatial extensions to manipulate geographic data. One caution is that it uses some syntax that departs from the SQL standard.19
PostgreSQL/PostGIS: A complete, functional open source DBMS, Postgres (as it’s commonly referred to) seems to be the most popular for open-source web mapping. It requires OSGeo’s PostGIS extension, which comes with the standard Postgres installation, to handle georeferenced data. It is used by OpenStreetMap, GeoServer, MapServer, and CartoDB (see Part 7).20
SQLite/Spatialite: A “light” open-source DBMS, unlike MySQL or Postgres, SQLite doesn’t need a server to run. It also doesn’t require any set-up or configuration to run, but just uses a command-line interface to create and manipulate databases and tables, and writes the databases as .db files. Spatialite, an extension that gives SQLite geospatial support, must be downloaded separately. It is modeled on PostGIS and comes with its own graphics user interface.
There are bunches of other DBMS out there that support spatial data. Big-name products include IBM DB2, Oracle Database, Microsoft SQL server, Sybase/Boeing Spatial Query Server, and GE’s Version Managed Data Store. The growing number of “NoSQL” databases—which, as you might expect, use a different language than SQL—might prove worth experimenting with for advanced web programmers. Graph databases such as AllegroGraph and Neo4j store data as linked nodes. CouchDB and MongoDB store data as JSON documents. SpaceBase is built to store complex spatial objects and uses a Java or C++ interface.21
Many database systems can handle rasters, though storing them in a database may not give any performance gain. Which is a better storage strategy apparently depends on who you ask.22
Sources:
15Scharl, A. and Tochtermann, K. (eds.). 2007. The Geospatial Web: How Geobrowsers, Social Software and the Web 2.0 are Shaping the Network Society. London, UK: Springer.
162012. Geography Markup Language. Wikipedia. Accessed July 6, 2012. <http://en.wikipedia.org/wiki/Geography_Markup_Language>
172012. Scalable Vector Graphics. Wikipedia. Accessed July 22, 2012. <http://en.wikipedia.org/wiki/Svg>
182012. Portable Network Graphics. Wikipedia. Accessed July 10, 2012. <http://en.wikipedia.org/wiki/Portable_Network_Graphics>
192012. MySQL. Wikipedia. Accessed July 10, 2012. <http://en.wikipedia.org/wiki/Mysql>
202011. Databases and Data Access APIs. OpenStreetMapWiki. Accessed June 29, 2012. <http://wiki.openstreetmap.org/wiki/Databases_and_data_access_APIs>
212012. Spatial Database. Wikipedia. Accessed July 10, 2012. <http://en.wikipedia.org/wiki/Spatial_database>
22Davis, Scott. 2007. GIS for Web Developers: Adding Where to Your Web Applications. Raleigh, NC: The Pragmatic Bookshelf.