
Part 4: Open JavaScript Libraries
For many of the tile services listed in Part 3, the purveyors of the tiles provide their own fully functional API that allows you to build on their map and make it available to clients. However, some of them—like MapBox, Stamen, and OpenStreetMap—just provide you with the basemap (and in OSM’s case, the data), and you get to figure out how to access it. The same decision is necessary if you create and serve your own tile sets (see Parts 5-7).
One option is to use the built-in functions of a maps API such as Google Maps, Bing Maps, MapQuest, or ESRI ArcGIS to access these other sources instead of their creators’ maps. An API is just a JavaScript (or other programming language) library that interfaces with code kept on the company’s server. Thus, while the client-side code is open-source, the back-end functions called by it are not. But there are a bunch of super-smart developers in the open source world who have been hard at work over the past several years creating alternative JavaScript libraries for web mapping, the functionalities of which both overlap and differ in numerous ways. In most cases, these libraries can also pull in the big-name basemaps. The cross-compatibility of all these tools allows for a wide and growing variety of possibilities when it comes to making cool web maps. And, if you get good enough (as I am attempting to do), you can always write your own functions to do something nifty that no one’s thought of yet.
Because there is so much overlap and extensibility, trying to categorize all of these tools can be tricky.11 Many combine multiple functionalities in one package, and can be layered and intertwined. Looking at the broad overview of what’s out there, they can generally be grouped according to a functional hierarchy. What I’m calling base libraries are stand-alone script packages that include the basic functions needed to display a tile map or WMS in an interactive user interface. jQuery extension libraries are a half-step removed from the base in that they rely on also having jQuery attached to the web page; I consider it a half-step because jQuery is such a common “dialect” of JavaScript. Wrapper libraries are those that translate one or more libraries’ functions into a different syntax. Extension libraries (also sometimes called Toolkits) are any for which a basic map call function is not native, but requires the concurrent use of a base library. A final class is libraries that are not specific to mapping, but can act as useful extensions for mapping libraries.
How to know which base library to start off with? While researching, I stumbled upon a forum with the below quote from Tom Carden, a developer of Modest Maps and Polymaps. Here is his expert advice:
“+1 on OpenLayers, the swiss army knife of open source mapping. Don’t overlook Google Maps if you want plug-and-play. Choose Modest Maps or Leaflet if you want a minimal foundation and tight control over behaviors. Choose Polymaps if you want API harmony with D3 and especially if you love SVG.”12
Base Libraries:
1. OpenLayers: The interface engine used by the OpenStreetMap website, OpenLayers is the most heavy-weight and versatile of the open-source JavaScript libraries, the grand workhorse of open-source web mapping. It does pretty much everything. It was built by MetaCarta but is now under the domain of the Open Source Geospatial Foundation, and is totally open and free. It can draw from GeoRSS, WMS, WFS, and TMS, and Google-style tiles, supports any map projection, and can handle up to 75 layers.13 Markers and pop-ups are customizable. The documentation assumes a fair bit of JavaScript programming experience, but is highly developed and includes a wealth of user examples. It’s also safe to say that with the largest community of active developers around it, OL will be kept very up-to-date.
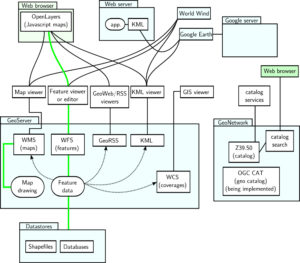
A diagram of a GeoNetwork utilizing GeoServer and OpenLayers from Wikipedia (original author SEWilco, modified by Belamp). Green lines represent read/write paths, and dotted arrows represent mostly read-only data flow.14 Compare to my first diagram in Part 5.
2. Leaflet: Built by CloudMade, the spinoff owned by OSM founder SteveCoast, Leaflet is the lightweight counterpart to OpenLayers. It can work with CloudMade’s basemap, which uses underlying OSM data and allows custom styling, or pull in different tile services and/or WMS layers. It can direct-add vectors and works especially well with GeoJSON objects. All of the usual interaction functionality is there—panning, smooth zooming, shift-zoom—along with CSS-customizable pop-ups and controls. A few custom projections are offered. Update: On July 30, 2012, the developers released Version 0.4, which integrated a few new functions, simplified the syntax, greatly updated the documentation (which is now very user-friendly), and debuted a list of the known independently-developed extensions on the library’s website. The syntax is meant to be backwards-compatible with previous versions, although there may be some issues there. These updates add to Leaflet’s position as a first-rate JavaScript mapping library.
3. Modest Maps: If Leaflet is light, Modest Maps is, well, modest. A joint project of Stamen, Map Box, and Bloom, it provides bare-bones functionality for loading tile layers and handling map events, without even providing visible interface controls. It is meant to be built on top of, so may be a good option for crack programmers who want a lot of flexibility to build their own thing from near-scratch. For others, the Wax library (covered below) adds quite a bit more out-of-the-box functionality.
4. Polymaps: Claiming their place at the cutting-edge, Stamen and SimpleGeo (since purchased by Urban Airship) put together a whole different animal from the first three libraries. While it can deal with raster tilesets, it is built to layer vector data in SVG format (for more on SVG, see Part 5). The library takes in GeoJSON objects and renders their data as SVG graphics, rendering only the features that are within the bounds of the requested tiles. Styles are applied to the features through CSS rules. Instead of constructor functions, the library uses jQuery-style chaining of factory methods to add layers to the map, with each layer turned into its own dynamic SVG. Maps are non-interactive by default, with interaction and controls added by separate function calls. Nicely-styled zoom buttons are provided, but because it doesn’t rely on the dimensions of fixed-size raster tiles for the map scale, using a mouse wheel gives you an almost infinite number of zoom levels. Each feature on the map can be dynamically restyled, making it a powerful engine for interaction, animation, and thematic mapping. Despite all of this dynamic rendering, the vector-tile approach makes it relatively fast. The downsides are a lack of support for non-Web Mercator projections, and the reliance on SVG means that it won’t work in many older browsers.
5. ka-Map: Last updated in 2007, this library can officially be considered old school. It was primarily designed as a web GIS interface for maps served with MapServer. It looks the part, with an ArcView-style toolbar and legend panel. It uses tile services and can overlay some vectors. Documentation is spotty at best.
6. Kartograph: Bucking the tile trend completely, Kartograph renders and styles pure SVG maps. It consists of two parts: a Python script to render an SVG map from ESRI shapefiles, and a JavaScript API to style the map, add interactivity, and display it in a browser. Because tiles are avoided, any projection can be supported as long as it’s embedded in the shapefiles before rendering. Quite a bit of styling can be done, including advanced effects like drop shadows and inner glow, and interaction with individual features can be added. The demo maps are quite beautiful. The downsides are a lack of documentation due to its newness, and there appears to be no native support for zooming or panning. There are some demos and a startup tutorial. Bottom line: this is a new alternative to tile maps designed to support custom cartography, and won’t be useful as an add-on to other libraries covered here.
jQuery extension libraries:
7. jQuery Geo: Yes, they went there. Applied Geographics, Inc., the makers of jQuery, the most popular general JavaScript library on the web, are working on a mapping library. An up-front warning: it’s still in alpha and buggy. But as new functions come online, they are releasing the code to the open source community. You can expect the same sort of shorthand syntax as regular jQuery for this library. It can load any public tile set, but you can also just tell it to make a map and it will display OSM tiles as a default. Hopefully you can make the interface widgets smaller than the giant boxes that take up a quarter of the map space in their examples so far.
8. jump: A very lightweight jQuery extension map library, jump relies on OSM tiles as a default. The zoom/pan interface is crudely drawn and doesn’t even style the mouse pointer appropriately. There are four demos on the site and no other documentation; the methods shown just include adding markers and events and custom code for using a different tile server.
Wrapper libraries:
9. Mapstraction: An API wrapper, Mapstraction translates base libraries into a universal syntax, allowing for quick switching between tile map providers. It currently supports Google, Bing, MapQuest, Leaflet, OpenLayers, and some deprecated and foreign APIs. Their sandbox application is a useful tool for working with examples, and the documentation seems relatively complete. The trade-off for simplified coding is that it may not have the full functionality of its clients, and given that virtually any API can draw basemaps from multiple sources nowadays, it may be more useful simply to learn the ins and outs of one base library and stick with it.
10. MapQuery: This wrapper for OpenLayers translates it into jQuery syntax and adds some of its own widgets, including different zoom buttons/slider, mouse position listener, pop-ups, layer controls, and windows. It requires jQuery to be included. There isn’t much for tutorials on the website, but the documentation is thorough.
Extension libraries:
11. Wax: Designed by MapBox to work with Modest Maps, this extension library takes advantage of layering functions in a host API (Modest Maps, Leaflet, OpenLayers, Polymaps, Google, or ESRI) and builds on them with custom interface tools, widgets, and interactions. It also allows you to access tilesets stored on the MapBox server through its TileJSON process, whereby generic script is stored in a JSON file that accesses the tiles.
12. GeoExt: An extension for OpenLayers based on the Ext JS library, GeoExt provides useful methods for info panels, windows, pop-ups, forms, and other interface widgets. It is particularly useful for displaying layer trees and feature attributes. It also has some methods for interactive map printing, though the examples of this on the website don’t seem to be working at present. It requires including Ext JS 4 and OpenLayers to function.
13. ReadyMap: This library from Pelican Mapping renders 2D and 3D imagery on a WebGL globe surface. It pulls in data using WMS and TMS, and can interface nicely with OpenLayers and Leaflet to reproject web maps built with them. There’s not a lot of options here yet other than what you build into OpenLayers and Leaflet, but plans for add-ons appear to be in the works. The interface does allow you to zoom, pan, and rotate the scene smoothly and efficiently. Documentation is sparse, consisting of 20 or so examples that you can “view source” from and a user forum.
14. Timemap.js: This aptly-named library designed to plug into Google, Bing, or OpenLayers renders temporal datasets in GeoJSON, KML, or GeoRSS simultaneously on a map and an interactive timeline, using code developed through MIT’s SIMILE project. Features appear on the map only when they are visible on the timeline, and disappear when not; they can also be animated using the timeline as a controller, with tweening methods available to make the animation smooth.
15. Cartographer.js: Still in alpha, this library extends the Google Maps API to easily add nice-looking choropleth, proportional symbol, and pie chart layers using the Raphaël library to draw features as SVGs. It comes with pre-encoded polygons for U.S. states and counties to render as choropleth features. The proportional symbol method supports multiple resolutions, clustering point data at smaller scales and creating more separate symbols at larger scales.
Useful non-map-specific libraries:
16. Processing.js: This JavaScript wrapper library translates files written in Processing, an open-source graphics and animation development language, to HTML5 canvas elements. This allows Processing to be the first out of the gate to have the full interactive functionality of a rich internet application on the web without using a plugin. As a side-note, the Processing library Unfolding is designed to facilitate the development of interactive thematic maps and geovisualizations. Flash mapping buffs, take note.
17. D3: Dubbed as shorthand for “Data-Driven Documents,” this library cooked up by programmer Michael Bostock is designed to dynamically render and style HTML DOM objects from datasets. Its d3.geo.path function projects GeoJSON files as SVGs, making it a potential tool for thematic vector-based mapping, but without tiling embedded. There is a custom tiler available in the examples section of the documentation, and D3 also integrates well with Polymaps, the SVG-based tile mapping library. It includes four built-in projections, and can read in any other projection equation. It’s pretty too, with support for animation and smooth transitions.
18. Raphaël: A lightweight vector drawing library developed by Dmitry Baranovskiy, Raphaël uses XML-based VML to create SVG graphics and embed them as interaction-ready DOM objects in the web page. Maps can be fully created from vector files transformed into XML, and vector layers created with Raphaël can be layered onto existing tile maps using a tile mapping library. The documentation is pretty light and there aren’t any tutorials, so look around for examples to get you started.
Sources
11Carillo, German. 2012. Web Mapping Client Comparison v.6. Accessed July 20, 2012. <http://geotux.tuxfamily.org/index.php/en/geo-blogs/item/291-comparacion-clientes-web-v6>
12Carden, Tom. 2011. Re: d3 and map libraries. Accessed July 23, 2012. <https://groups.google.com/forum/?fromgroups&pli=1#!topic/d3-js/4CQ7tmpDi-E>
13Schütze, Emmanuel. 2007. Smart Map Browsing (thesis). Bremen, Germany: BremenUniversity of Applied Sciences.
14File:GeoServer GeoNetwork with web app.svg. 2010. Accessed July 23, 2012. <http://commons.wikimedia.org/wiki/File:GeoServer_GeoNetwork_with_web_app.svg>