
Geography
Great Lakes
Level of Effort
Low
Overview
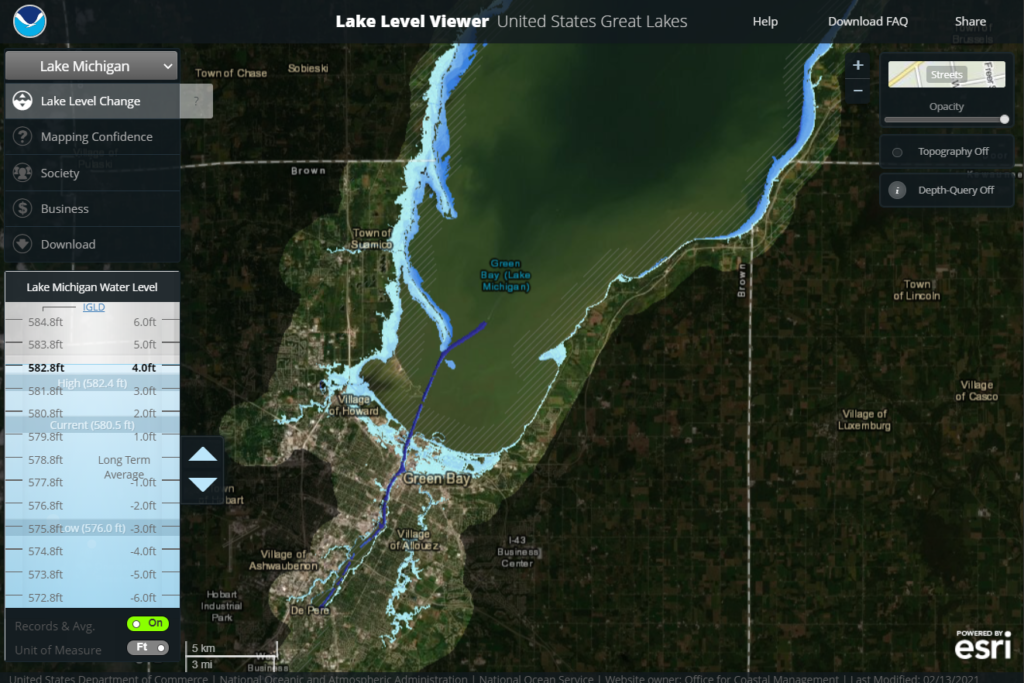
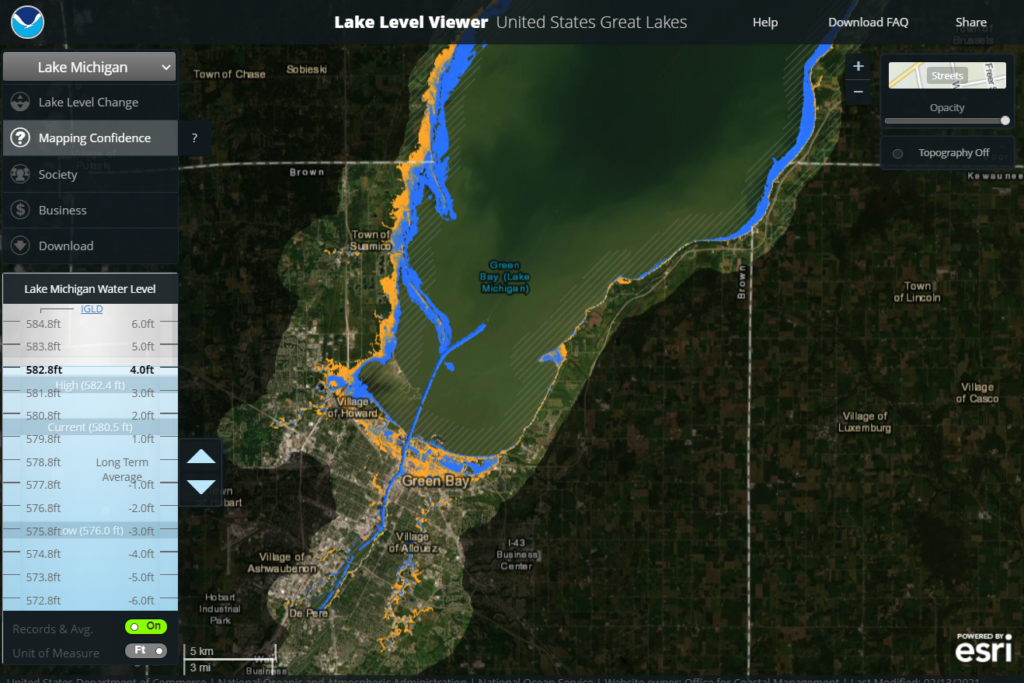
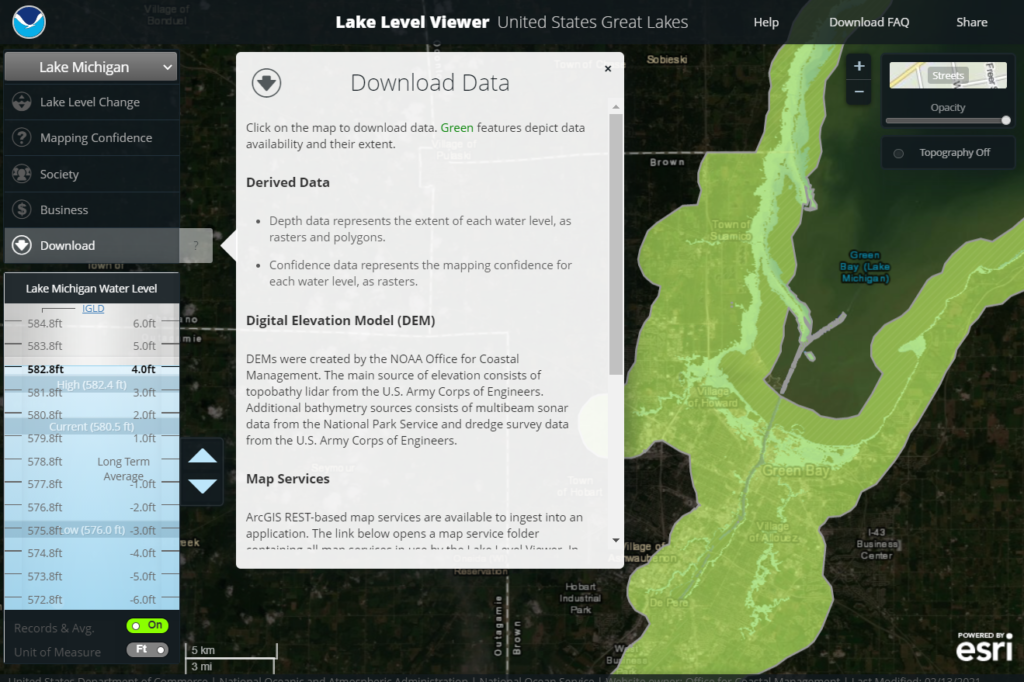
This interactive map visualizes the extent and impacts of rising and falling water levels along the shores of the Great Lakes from six feet above average lake levels to six feet below in one foot increments.
Features
- Visualize the extent of inundation and lakebed exposure associated with changing water levels on the Great Lakes
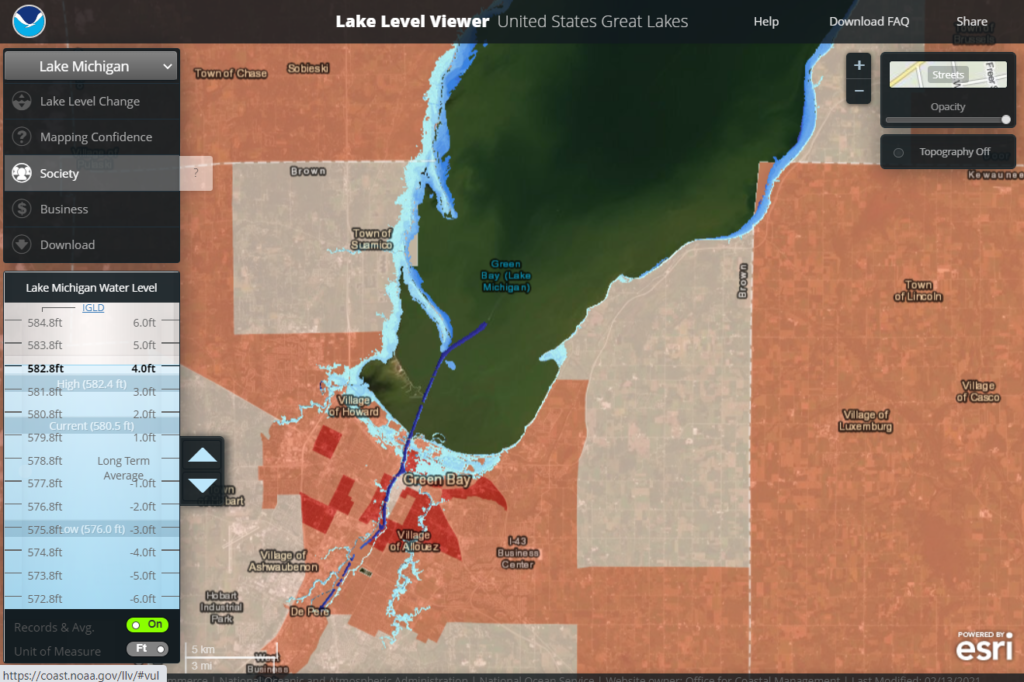
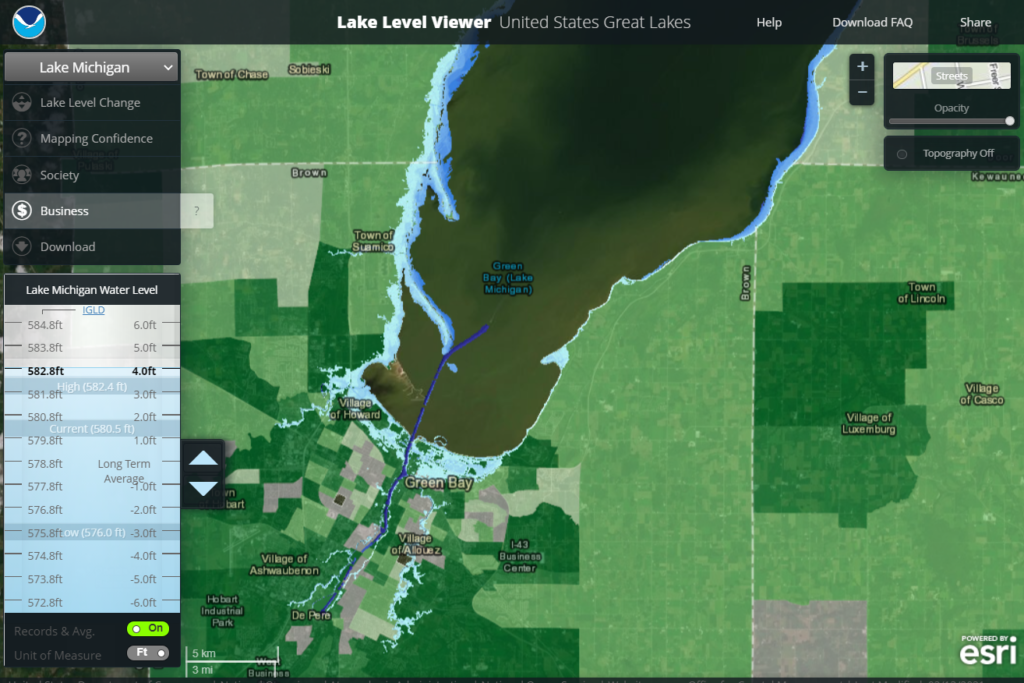
- Correlate maps of social vulnerability and economic activity with lake level change
- Obtain direct access to ArcGIS REST-based map services of data supporting the Lake Level Viewer for customized analysis
Guidance & Resources
The Lake Level Viewer is a web-based interactive map that requires a low level of effort to use. The geographic coverage includes the U.S. coasts of the Laurentian Great Lakes. The target audience includes local community planners and public works staff; coastal, floodplain and natural resource managers; extension and outreach specialists; and coastal property owners.
Map Custodian & Partners
Related Data & Tools
- NOAA Great Lakes Environmental Research Laboratory
- NOAA Office for Coastal Management
Publications
Roth R., Hart, D, Mead, R., and C. Quinn. 2017. Wireframing for interactive & web-based mapping: Designing the NOAA Lake Level Viewer. Cartography and Geographic Information Science. 44 (4), 338-357.
Roth, R.E., Quinn, C. and Hart, D., 2015. The competitive analysis method for evaluating water level visualization tools. In Modern trends in cartography (pp. 241-256). Springer, Cham.
Schmid, K., Hadley, B. and Waters, K., 2014. Mapping and portraying inundation uncertainty of bathtub-type models. Journal of Coastal Research, 30(3), pp.548-561.
Tags
water levels, visualization, coastal flooding, inundation, topography, bathymetry, elevation, Great Lakes, Lake Michigan, Lake Superior, Wisconsin, NOAA